Ichimoku Kinko Hyo: A Unique Japanese Technical Tool
Overview
Ichimoku Kinko Hyo is a distinctive technical analysis method originating in Japan. It combines five lines and a “cloud” with candlestick charts to analyze market trends. Although it might seem complex due to its multiple components compared to other technical analysis methods, it becomes quite straightforward once you grasp the key points. This guide will explain the fundamentals of Ichimoku Kinko Hyo and how to use it effectively to forecast market trends.

Understanding Ichimoku Kinko Hyo
What is Ichimoku Kinko Hyo?
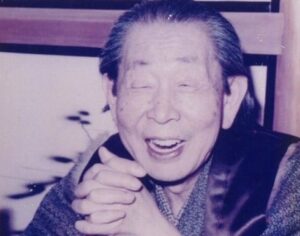
Developed in 1936 by Goichi Hosoda (pen name: Ichimoku Sanjin), Ichimoku Kinko Hyo is a renowned Japanese charting technique. Hosoda reportedly spent seven years perfecting this method with a team of 2,000 researchers. While initially designed for stock analysis, it has since been adapted for other markets, such as forex.
What sets Ichimoku apart from other technical tools is its focus on time as the primary factor, treating price as secondary. Instead of focusing on “how much,” it emphasizes “when.” Built on the idea that markets move in the direction where the balance between buyers and sellers breaks, Ichimoku Kinko Hyo provides an immediate overview of such shifts. Its popularity extends beyond Japan, as investors worldwide appreciate its utility. The method’s lines often act as resistance or support levels.
The method’s legacy is preserved by Economic Cycles Research Institute, managed by Hosoda’s descendants, which promotes its use and distributes original resources.
The Five Lines of Ichimoku Kinko Hyo
Ichimoku Kinko Hyo consists of five lines:
- Tenkan-sen
- Kijun-sen
- Senkou Span A & B
- Chiko Span
While the calculations may seem intricate, understanding their meanings and visual interpretations enables you to make informed trading decisions.

Kjun sen
The Kijun-sen connects the midpoint of the highest and lowest prices over the past 26 days, representing medium-term market direction. For example, if the highest price is 100 and the lowest is 90, the Kijun-sen value is 95. This “26” is a fundamental value in Ichimoku, typically fixed.
Tenkan sen
The Tenkan-sen shows short-term market trends by calculating the midpoint of the highest and lowest prices over the past 9 days. Like the Kijun-sen, it uses fixed intervals (e.g., 9 days).
Senko span A & B
- Senkou Span A: The average of the Kijun-sen and Tenkan-sen, plotted 26 days ahead.
- Senkou Span B: The average of the highest and lowest prices over the past 52 days, plotted 26 days ahead.
The area between these two spans forms the “Kumo”, a key visual element in Ichimoku charts, which forecasts potential future trends.
Chiko span
The Chikou Span is the closing price shifted back 26 days. It allows comparisons between the current price and the price 26 days prior. Often considered the most critical component of Ichimoku, it provides valuable signals for trend strength and reversals.
How to read Ichimoku Kinko Hyo
Choosing the timeframe
While Ichimoku can be applied to various timeframes, its creator advocated using daily charts for accuracy. The fundamental values of 9, 17, and 26 are based on daily intervals. Analysis can involve individual lines or combinations for deeper insights.

Analyzing Key Combinations
1. Tenkan-sen & Kijun-sen
- Direction of Kijun-sen: Indicates market trend (upward for bullish, downward for bearish).
- Crossovers: When the Tenkan-sen crosses the Kijun-sen, it signals potential buy or sell opportunities:
- Golden Cross (upward): Buy signal.
- Dead Cross (downward): Sell signal.
2. Senkou Span (Kumo Analysis)
- Position of Candlesticks:
- Above the cloud: Bullish market.
- Below the cloud: Bearish market.
- Cloud Breakouts:
- Candlesticks crossing above the cloud signal a strong buy opportunity.
- Crossing below signals a sell.
3. Chikou Span (Lagging Span)
- When the Chikou Span crosses above or below candlesticks, it serves as a buy or sell signal, respectively.
Three Theories of Ichimoku Kinko Hyo
Time Theory (Time Cycles)
Focuses on the importance of time, using core intervals like 9, 17, and 26. Additional composite values, such as 33 or 42, mark potential turning points.Wave Theory
Analyzes market waves using three patterns:- I-Wave: A single rise or fall.
- V-Wave: A rise followed by a fall (or vice versa).
- N-Wave: A rise-fall-rise (or fall-rise-fall) sequence.
Price Projection Theory
Predicts future highs and lows using four calculation methods: E, V, N, and NT values. These projections provide target levels for market tops and bottoms.
Tips for Effective Use
Targeting Sanyaku Kouten
This refers to a combination of three bullish signals:
- Tenkan-sen crosses above Kijun-sen.
- Chikou Span crosses above candlesticks.
- Candlesticks break above the cloud.
When all three align, a strong bullish trend is anticipated. Conversely, the reverse signals a bearish trend (San’yaku Gyakuten).
Integrating with Other Tools
While Ichimoku focuses on time, combining it with price-focused tools enhances its utility, enabling better analysis of pullbacks and breakouts.

Useful Video Lessons
Getting Started
To begin, simply display Ichimoku Kinko Hyo on a chart alongside candlesticks. Observe the cloud’s thickness and the relative position of candlesticks. Gradually familiarize yourself with its signals, and you’ll soon understand why Ichimoku remains a globally respected analysis tool.